Land · On the water
The Angler Angle
A depth chart assembled out of public survey data, and the scoring engine that decides whether to go at all. The chart is the part people want to look at. The engine is the part that took the thinking, and most of what it does is say no.
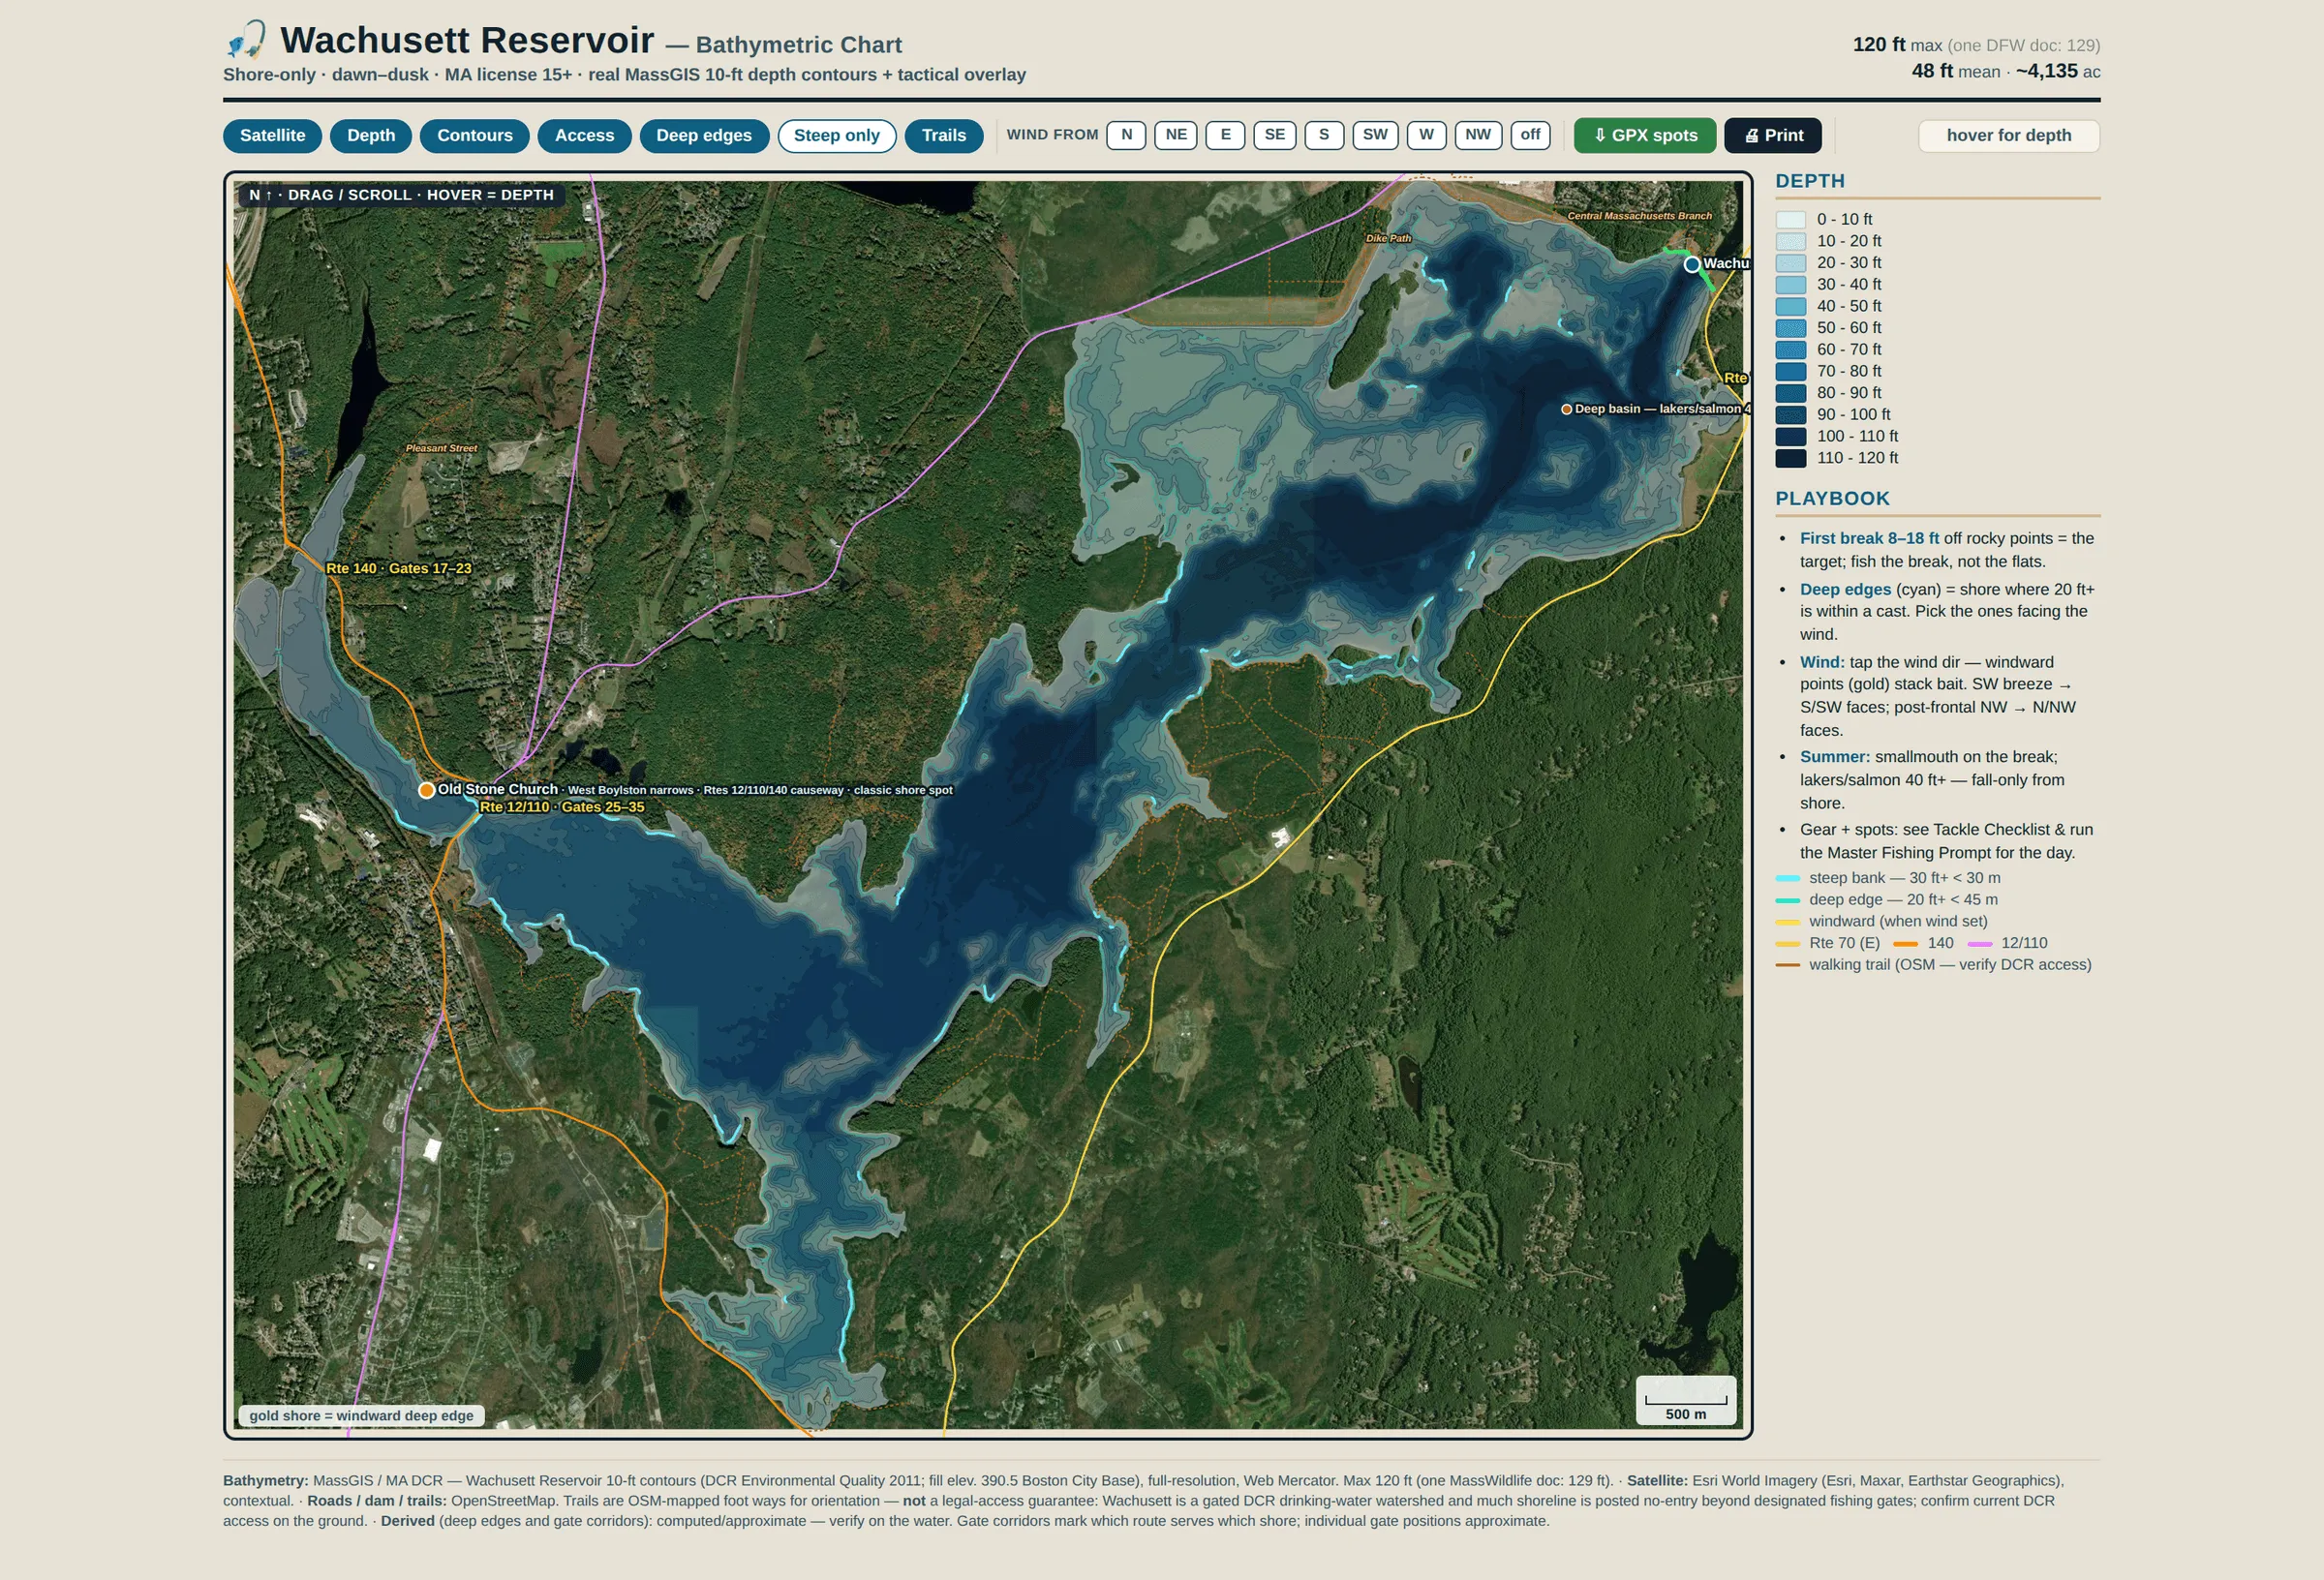
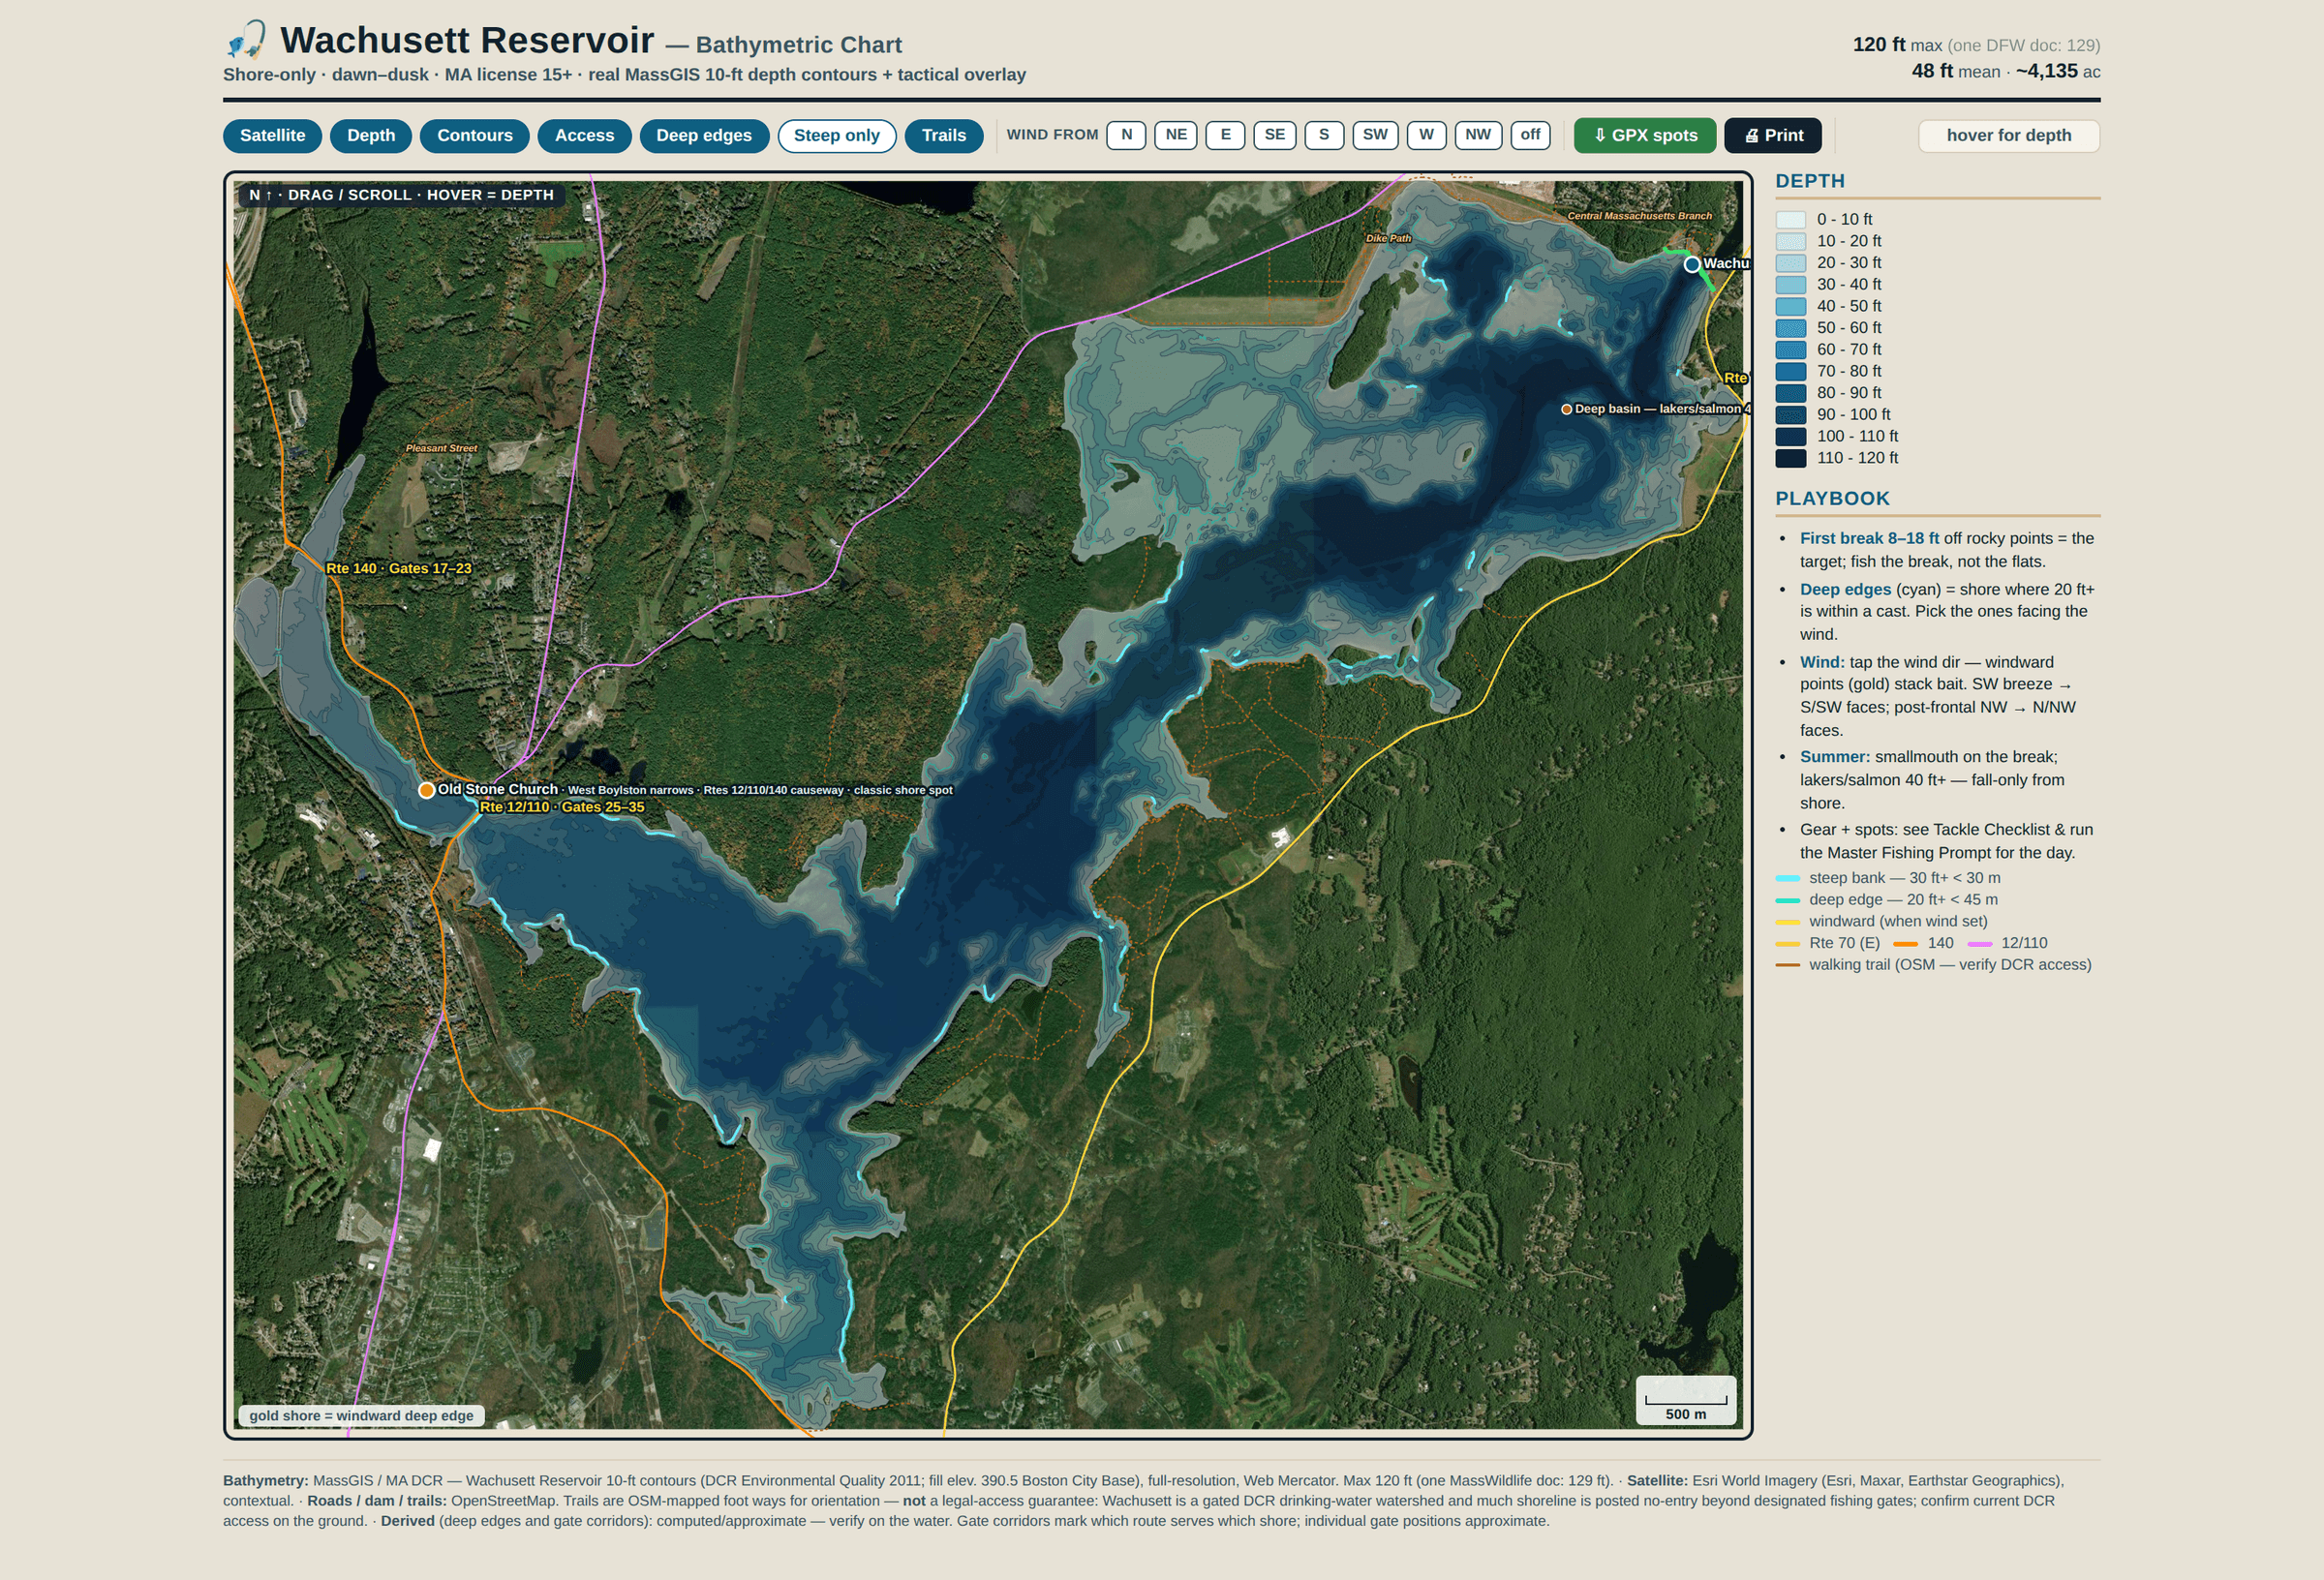
The chart
Twelve depth bands from the shoreline down to a hundred and twenty feet, drawn from the state's own ten-foot bathymetric contours, laid over satellite imagery, with roads and foot trails from OpenStreetMap for orientation. None of that is mine — it is public data that has been sitting in a GIS portal for over a decade. What I did was put it in one file.
That last part is the only engineering claim worth making about it. The whole chart is a single HTML document with the imagery inlined — one script tag, no tile server, no map library, no network calls of any kind. It opens on a phone, standing on a shoreline, with no signal. Which is where you are when you need it.
The geometry is simplified to about five metres, which sounds sloppy and is deliberate: five metres is roughly one pixel at full extent, and comfortably shorter than a cast. Simplifying further would have made the file smaller and started throwing away water I might actually fish.
The layer that isn't in the survey
Depth contours tell you where the water is deep. They don't tell you where to stand. The layer I care about is derived: two hundred and seventy-four stretches of shoreline where twenty feet of water sits within casting distance of dry land. A bank you can reach the drop-off from is worth more than a deep hole you can't.
Each of those edges carries the compass bearing of the shore it belongs to, which makes the last control useful. Pick a wind, and the edges facing into it light up while the rest go quiet. Wind stacks bait against a shore; the chart will tell you which shore that is today, and it does it without knowing anything about today.
The score, and the cap that makes it honest
Underneath the chart is a hundred-point readiness score: barometric trend and the shape of the front, solunar timing measured inside legal fishing hours, water temperature against the species band, light, wind and clarity, season phase, and whatever the last trip actually found.
The score is not the interesting part. Any of us can weight seven inputs. The interesting part is that five hard caps sit above the total and overrule it — and the best of them is this: if no trip log has ever recorded a named, castable, legal position on a water, that water cannot publish above fifty, no matter what it scores.
There is a coastal water on the list that grades out at sixty-seven on merit and prints at fifty. Every condition is right. I have never stood anywhere on it and written down where I stood. So it loses to a water I know, and it keeps losing until I go scout it — which is the correct outcome, because a well-scoring guess should never beat a worse-scoring fact.
It is the same idea as the amber verify flag on the tractor — an admission of thin evidence, made expensive enough that I have to clear it rather than live with it.
The afternoon it was wrong by twelve miles
For two months every forecast the system pulled for the reservoir was for the wrong place. Not slightly wrong. Twelve miles wrong, and consistently.
The coordinates had been resolved from a place-name lookup, and there is a mountain in this state with the same name as the reservoir. The lookup returned the mountain. Everything downstream was obedient and correct: the right forecast grid, the right hourly pull, the right barometric station — for a summit in another town. Nothing failed. Nothing was flagged. The numbers just quietly described somewhere I was not.
The fix is one line of doctrine, and it is not clever: never resolve a water's coordinates from a name search alone — verify against a geometry source for that specific body of water. The lesson underneath it is the one I keep relearning. A system that is confidently wrong produces exactly the same output as a system that is right, and it will go on doing it until something outside the system checks.
What it can't do yet
Twenty-one trip logs. Every outcome field is blank.
The feedback loop is built — the log has a slot for what actually happened, the rubric has a category that reads from it, and the whole thing is designed to get better at exactly the rate I feed it. I have fed it nothing. The scoring is therefore still doctrine and weather, with no evidence in it at all, and it will stay that way until I start writing down what I caught.
I know precisely how to fix this and have not fixed it. That is worth saying plainly, because the alternative is a page that implies the loop is closed.
How it's built
Standard-library Python against keyless public APIs — the national weather service for the forecast grid, the tide service where a station resolves, the geological survey for river flow. No accounts, no keys, nothing to renew, nothing that can send me an email about pricing in two years.
Every feed has the same contract, and it is the only rule that matters: when a source fails, say so and return nothing. The stocking feed blocks automated requests, so it stubs and discloses rather than inventing a stocking event. A short pull from the access dataset fails the whole run rather than proceeding on partial data. The solunar calculation is a lunar ephemeris I wrote from scratch, for the least romantic reason available: the service I had been calling started returning nothing at all, silently, and I would rather own the arithmetic than discover a dependency has been feeding me zeros.
None of that was necessary to catch a fish. I built it because the problem was interesting and I wanted to see whether a forecast could be made honest about its own gaps. That is the real reason, and it would be a bit precious to pretend otherwise.
The same discipline, pointed at hunting ground, is here — and it has been even less generous about saying yes. The land it all sits on is here.